A Comprehensive Guide to Staffing Your Agency
Introduction
Having trouble striking the right balance within your team? You’re not alone in this struggle. Crafting a comprehensive staffing plan is essential for achieving business success and reaching your strategic goals.
This process involves careful analysis of past projects, accurate forecasting, and pinpointing areas that require improvement. You may find yourself caught between a delivery team that claims to be overwhelmed and a financial team that believes you have excess staff. It’s challenging to know whose perspective to trust, isn’t it?
At the end of the day, ensuring your team is supported and set up for success should be a main priority. By developing a well-thought-out staffing plan, you’ll be well on your way to assembling a strong and capable team that drives success and helps you achieve your strategic objectives.
In this blog post, we’ll show you how to use objective data to gain the clarity you need to make informed decisions about hiring and determining the right amount of staff. We’ll also guide you in assessing the efficiency of your investments. You may be surprised about how involved this process can (and should) be.
Stay with us as we guide you through this process, equipping your business for lasting success.
Laying the Foundation
Creating and maintaining your staffing plan can be done with a much more quantitative approach than you may have thought. Ask yourself – what needs to be true for your staffing plan to make economic sense?
If you can get an idea of which metrics you need to keep an eye on, what those metrics are telling you to do, and pair that with your future goals for your agency, you’ll be on track for success. These metrics and benchmarks are:
Delivery Margin
The single most important metric for you to track, and the metric that should always be considered when making staffing decisions is Delivery Margin. It’s the revenue you’re making from your services minus the cost it takes you to deliver.
Delivery Margin ($) – Agency Gross Income (AGI) – Delivery Costs
Delivery Margin (%) – (AGI – Delivery Costs) / AGI
The percentage version of the formula measures the portion of each dollar of revenue that remains after deducting delivery expenses. So, you can then ask yourself, for each dollar that we bring in at our agency, how much do we need to keep for this boat to stay afloat? 50 cents of each dollar?
Typically, 60% Delivery Margin is a good goal. Considering this when tweaking your staffing strategy is integral to success. Here is a detailed breakdown of how staffing can impact your Delivery Margin.
Staffing and its Impacts on your Delivery Margin
Let’s go through a few real-world examples of how your staffing impacts Delivery Margin. These metrics are:
- ACPH (Average Cost-Per-Hour)
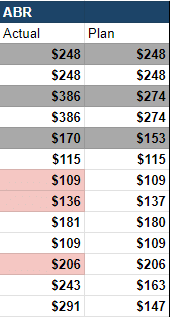
- ABR (Average Billable Rate)
- Utilization
We cover exactly how they can move each other in this post.
But for real world examples of situations where your Delivery Margin can be impacted, let’s go through three.
1. Your prospective client wants a discount. How much can you afford to give them while maintaining your ideal Delivery Margin?
In this scenario, knowing your Average Cost Per Hour will help give you an idea of what the project is going to cost you. This metric is linked with Delivery Costs, and therefore Delivery Margin.
2. You’ve got approval to make a hire for your agency. Each department says they need help. Choose which team needs to have a team member added to it.
In this scenario, it would be helpful to know how Utilized each department is. This metric “Utilization” measures the amount of time that your team is spending on revenue-earning activities and therefore can help gauge who needs the most help, and where an investment might be worth making. The more utilized your team is, the higher Delivery Margin you can expect to be getting.
3. Again – you’ve got approval to make a hire for your agency. This time, you want to know where you’re going to see the greatest impact in profitability.
In this scenario, getting an idea of each revenue streams ABR (Average Billable Rate) will show you where you’ll make the most bang for buck. It will show you the most efficient earning revenue stream.
Overhead Benchmarks
Keeping tabs on and understanding ideal overhead spending benchmarks will help you staff your agency appropriately. There are a benchmark range that we at Parakeeto have came up with, and are grouped into three categories:
- Sales & Marketing
- Admin
- Facilities
For S&M – you want to aim for spending 8-12% of your AGI on this department.
For Admin – you want to aim to spend 8-12% of your AGI as well.
For Facilities – aim for 4-6% of AGI.
Agencies do differ, and so it’s less important to spend within each range above, and more important that together they represent somewhere from 20-30% of your AGI. Any less, you might be underinvesting. Any more, you might be spending too much.
Salary Allocations
To accurately distribute your team’s salaries into their respective departments, ensure you’re assigning each member a percentage of their salary to a specific department (or multiple, if that’s their role). This could look like this:
Name | Role | Sales & Marketing Dept. | Delivery Dept. | Admin Dept. |
Joe | Designer | 0% | 100% | 0% |
Tim | VP Strategy | 10% | 90% | |
Sal | Exec Assistant | 0% | 10% | 90% |
Then, you can allocate their cost to a specific department, and using the benchmarks above, determine how your spending lines up with the industry benchmark.
Creating your own Capacity Model Spreadsheet
To effectively monitor the health of your team (not literal health, operational health) develop your own Capacity Model Spreadsheet.
This is a place where you can include information about each team member, their salary, benefits, role/dept, hours worked, and hours spent in each department. Your departments could look like this: Delivery, Sales & Marketing (internal) and Administration (internal). There is a template you can use in the agency profit toolkit if you’d like to use it.
‘Delivery’ is a little broad, isn’t it?
If your Capacity Model only shows your capacity for your Delivery team as a whole, it might not be that useful. Delivery could easily be 80% of your staffing. To make this effective, you can break it down into subsets of Delivery. We call these Role Categories.
For example, an illustrator and an animator have different roles, but both work in the “design” department for your agency.
Role | Role Category |
Illustration Designer | Design |
Animation Designer | Design |
The use of Role Categories also keeps your subsets general enough, as to not add in too many subsets and have a hard time gathering any meaningful data. What if you had a category for all of the design related roles like Graphic Designer, Web Designer, UX/UI Designer, Visual Designer, Brand Designer, Motion Designer… you get the picture.
With this model, which uses roles categories, you can easily incorporate a potential new hire into your plan and quickly understand how it affects specific areas of your business (departments or role categories). It will also help you determine the amount of revenue needed to fully support the new hire, its impact on your utilization target, potential delivery margin, and overhead ratios. More examples later in the post.
Creating your own Financial Forecasting Model
How much can you expect to bring in (AGI) with a new addition to the design team?
It’s not such a simple question to answer.
First, open up your capacity model that you created in the previous step. It should look something like this:
Name | Role | Role Category | Total Comp | Deliv Dpmt % | Admin Dmpt % | S&M Dmpt % | Hours Worked per week/year | Deliv Hrs Expected per week/year | PTO/yr |
Jake | Designer | Design | $90k/yr | 100% | 0% | 0% | 40/2080 | 32/1664 | 25 |
Pssst – would you like your own copy of a template like this? You can get it for free in the Agency Profit Toolkit, among other training videos and spreadsheets to take your agency to the next level. Grab yours below!
Check your inbox for your free toolkit!
There are a few steps to take to be able to figure out how to forecast the financials on a new hire (or the loss of a team member). To figure this out, use the following formula:
AGI = (Capacity x Net Utilization) * ABR
Step 1 – Determine Jake’s Capacity
First, figure out the annual capacity that Jake will have. As you can see above, he’s working 40 hours a week. On the year, that’s 2080. Don’t worry about vacation, we’ll factor that in in a later step. Jake’s capacity is 2080 hours a year.
Step 2 – Determine Jake’s Utilization
Next, we can determine Jake’s Utilization to knock that 2080 hour total into something that is only relative to his revenue earning hours. Ask yourself – for the 40 hours a week that Jake is working, how many of those hours are you expecting him to be working on Delivery work? Be sure to leave room for internal meetings, career development, unexpected slack DMs and such. 30 sounds reasonable. At 30 of 40 hours, that’s a 80% utilization rate.
Step 3 – Determine Jake’s Gross Delivery Capacity
Moving on, we’ll calculate his Gross Delivery Capacity by multiplying his Capacity (Step 1) by his Utilization (Step 2).
2080 * 0.75 = 1560
Step 4 – Determine Jake’s Net Delivery Capacity
Next, we’ll need to factor in time off (I told you we’d get there!)
With 25 days of annual vacation (annual PTO/yr in the chart) we can assume that’s 8 hours a day for 25 days a year, or 200 hours. Subtract this from the Gross Delivery Capacity to get 1360.
1560 – 200 = 1360
Step 5 – Determine Jake’s Net Utilization
We’re still going yet! Divide Jake’s new number of Delivery Hours (1360) by his total Capacity (Step 1) to get a Net Utilization number.
1360 / 2080 = 65%
Step 6 – Determine your Standard Rate
This one is largely up to you. What would you ideally like to charge for each hour of Jake’s time? We see the design/development industry sitting around the USD $160 mark these days. Let’s call it that for now.
Step 7 – Calculate the projected AGI Jake will Bring into your Agency
Finally, we can calculate the projected annual AGI for the year that Jake will bring in by multiplying the Net Delivery Capacity by your Standard Rate.
1360 * 160 = $217,600
This means that Jake will generate around 217k worth of revenue a year for your agency, as you’ve designed it. Or, it means that you’ll be losing this amount of revenue next year if Jake leaves the agency and isn’t replaced.
Your team’s Utilization, ABR and ACPH all have substantial impact on your Delivery Margin. By understanding the AGI targets you will need to set based on your staffing plan, you can reverse engineer a winning formula where your staffing plan hits enough AGI with a realistic level of Utilization & ABR to sustain the business.
Creating your own Planned Work Model
A crucial step here in the process is to also create a planned work model.
You should start by simply tracking the number of projected hours you have on a given project (or group of projects) and compare it to your Capacity Model spreadsheet to see if the number of hours available for your team is sufficient.
Let’s walk through a quick example – if you’re in the digital design industry, and you’re considering selling a new project to a prospective client, how can you figure out if your team can theoretically handle it? It will take 2 weeks to complete.
First, scope your project using the number of hours you think it will take per subset of Delivery (aka Role Category). If you think it will take 20 hours of the Design team, and 5 hours from the Project Management team, that’s a good base.
Design – 20h
Project Management – 5h
Now, compare it to the Role Categories total capacity on a weekly basis
Role Category | Hours /yr | Hours /wk | Project 1 |
Design | 2000 | 38.4 | 20 |
Project Management | 500 | 9.6 | 5 |
With the project taking 20 hours of your Design team’s capacity, and it being 2 weeks long, you’re going to need (20h * 2 weeks) = 40 hours of capacity in Design right now to safely start this engagement. With 38.4 available, you might be stretching your team thin.
Creating your Forecasting Plan
From here, you can implement both Top Down and Bottom Up resource planning to get an idea of what the future will look like for your team. Here is what a resourcing chart for your agency could look like (and one that we provide to our clients at Parakeeto):

Top Down Forecasting
This method is where you’ll use high level estimates about projects, informed by historical data to estimate the time required to complete a project by a Role Category. For example, 20 hours of the Design team, and 2 hours of the Accounts team. Add these up across a period of time, and you’ve got an idea of what the future looks like.
The benefit of doing this by Role Category, is that it actually saves you time rather than adding in precise estimates for each role involved in the project (which at some agencies could be upwards of 20 different people). The precision needed to do this actually boggs down the process, leading to potentially less accurate forecasting. This is our theory of precision vs accuracy, and how they’re not the same thing.
Bottom Up Forecasting
This method is the tried and tested approach of breaking down a project into smaller tasks and assigning them to each person on the team to do. It’s very precise, but it’s more of a short term method as it can be difficult to maintain as problems or changes arise, or for a longer term project.
Let the Machine Run
Now, we’ve set you up with a few different models that if used in collaboration can help you build and maintain a great team at your agency.
Your next step will be to start using these systems – let the machine run, and install feedback loops and touchpoints to check in on them. All of these models are made using assumptions (about salaries, time, availability, roles, sales, and more) so continually evaluate the inputs you’re using in these models to ensure they’re still up to date.
Compare the actual numbers (from your time tracking tool) to the assumptions you’ve made in your models above. You assumed that a team member will be 80% utilized this month – were they?

You assumed that for each hour of work, you’d bring in $250 in AGI (in other words, your average billable rate). What was it actually?
In Closing
A comprehensive staffing plan is an absolute must for any agency aiming to achieve maximum success. Your team is the beating heart of your business, and it’s paramount to have the perfect combination of talent, positions, and timing.
Granted, the task of creating a staffing plan can appear daunting at first. However, fear not! By developing models, keeping a close eye on key performance indicators (KPIs), and establishing feedback loops, you can confidently make well-informed decisions regarding hiring and resource allocation. Remember, collaboration with colleagues from various departments is key. They possess invaluable insights and can aid in gathering the necessary data.
By dedicating both time and resources to crafting a comprehensive staffing plan, you’ll be embracing a approach that empowers you to adapt swiftly to changes and make informed choices like a true authority. Not only will this bolster your agency’s success, but it will also safeguard the well-being of your exceptional team.
Rest assured, armed with a comprehensive staffing plan, you’ll be fully prepared to conquer any challenges that come your way and seize every exciting opportunity that arises.
Avid #APP Listener?!
We would be eternally grateful if you could leave us a review…

Agency Profitability Tool Kit
If you’re looking for more resources to help you improve your agency’s profitability, check out the Agency Profitability Tool Kit. It’s full of templates and checklists used when consulting clients. This helps them improve profitability by over 100% in under 60 days.
Fill out the form below for your copy!
Written by
Parakeeto
Free Resource
Get the Agency Profitability Toolkit
Free tools, templates, and training videos to measure the right metrics and improve your profitability.
Free Consultation
Ready to Improve Your Agency's Profitability?
Schedule a free consultation with a profitability expert to find out how much money you're leaving on the table.
Free Consultation
Related Posts

How to Identify the Right Leadership Style, with Audrey Joy Kwan — Ep. 143
About this Episode In this episode of the Agency Profit Podcast, Marcel welcomes leadership coach Audrey Joy Kwan, a seasoned strategist and leadership coach. With a background in scaling agencies from fledgling start-ups to bustling organizations, Audrey shares invaluable insights into the evolution of leadership roles within these dynamic environments. Holding a Master’s Degree in […]

Capacity Planning 101 for Agencies: Strategies, Benefits, and Challenges
Discover the essentials of capacity planning in our comprehensive guide. From understanding its importance and types to exploring tools, techniques, and challenges, dive deep into optimizing resource management for your business's growth and success.

Balancing Creativity and Profitability, with Tim Thompson –Ep.171
About this Episode In this episode of the Agency Profit Podcast, Marcel sits down with Tim Thompson, Owner and Chief Revolution Thinker at RevThink, to break down the financial frameworks that help creative agency owners take control of their cash flow and profitability. Marcel and Tim first connected at the MYOB conference, where they bonded […]

How to use “Zero Risk” Freelancers in Your Agency, with Ross Kimbarovsky – Episode 64.
Looking for Crowdspring reviews? Hear from the founder. Episode 64 of #APP Ross Kimbarovsky, of Crowdspring, discusses Zero Risk freelancers.

How to Hire your First Assistant and Reclaim your Time, with Amanda Hamilton – Episode 94
This week, Marcel chats with Amanda Hamilton of Hamilton Raye. She outlines how to hire an assistant, thus helping you buy back your time!

How to Transition from Entrepreneur to CEO, with Jason Swenk — Ep.152
About this Episode In this episode of the Agency Profit Podcast, Marcel welcomes back the legendary Jason Swenk. Jason, a pioneer in agency growth and a seasoned mentor, shares his incredible journey from founding and selling his agency to now guiding hundreds of agency owners through his Agency Mastery 360 program. This conversation dives deep […]

Buying Back Your Time, with Dan Martell – Episode 105
Founder and author Dan Martell joins Marcel to discuss something all agency owners should be focussed on – how to buy back your time

Hiring, Salaries, and Geo-Arbitrage in a Remote World, with Noel Andrews – Episode 82
In this episode of APP, Noel Andrews of JobRack joins Marcel to discuss Hiring, Salaries, and Geo-Arbitrage in a Remote World.

How to Increase Your Profit While Working Less Hours, with Mike Moll – Episode 88
In this episode of APP, Mike Moll of Market Me joins Marcel to outline how you can increase your profit while working fewer hours.