Your Agency’s Roadmap to Success: A Step-by-Step Guide to Building a Profitable Agency Model
If you’re an agency or executive, you’ve probably dealt with the struggle of trying to connect the dots between the operational metrics that guide your day to day, and the overall profitability of the business. It’s a story we hear all too often, the team is hitting all their targets for utilization and project profitability, and yet, the P&L still doesn’t look the way we expect.
Just when the puzzle pieces start to fit, a change in the business scatters them again. It’s like trying to hit a moving target – every tweak or shift in strategy feels like taking one step forward and two steps back. Putting it all together and getting a clear model for the business that is dynamic enough to facilitate scenarios and decision making can be a real challenge.
As a professional services firm, generic models you might find online just don’t seem to work for the nuances of this business model. The end result is feeling like you’re setting targets for the team based on a gut feeling, and hoping they’re directionally accurate enough to result in a healthy bottom line at the end of the year.
In this article, we’re going to break down how we approach building profitability models for agencies and professional services firms based on 5 years of exclusive focus on this problem. Not only will we walk you through the key pillars to a sound model, we’ll even provide you with a free template you can use to get started modeling your business today.
What Is a Profitability Model?
What exactly is a profitability model? It’s like a financial blueprint for your business, helping you crunch the numbers and check if your business is fundamentally sound, or destined to struggle. Some of our clients have described it as a magic crystal ball for their agency, answering some of their most important questions.
Will your agency be profitable in the long run based on how it is currently set up? What if you made some tweaks, like adding a few employees, or changing up your utilization expectations? ? What could your business really achieve, and where can you make some smart changes for better results? A profitability model works its magic by gathering some basic info about your company and then running different “what if” scenarios. So, it’s not just math; it’s your business’s crystal ball that can help you connect the dots between the decisions you make day to day, and the long term success of your firm.
The Importance of a Profitability Model
In the hundreds of hours I’ve spent speaking with agency leadership teams over the years, one problem has continued to come up over, and over again. Despite spending incredible amounts of time and effort setting up reporting systems, setting targets for KPI’s and trying different things to improve their performance – most teams I speak to feel like no matter what they do they can’t seem to get everything to come together.
One CEO said to me “I have my sales team hitting their targets, my operations team tells me all our projects are on budget, the delivery team tells me they’re incredibly busy. Based on our departmental reports, we’re hitting or exceeding all of our targets, and yet my EBITDA is 15% lower than I expect it to be. I just can’t seem to figure out why”
Another was losing over $1M in EBITDA 3 years in a row, despite hitting all his operational targets. He called me and said “I’ve been waiting to grow out of these losses for 3 years, but I’m starting to worry that it’s not possible, that our business just doesn’t work the way it’s set up. But to be honest, I don’t really know how to figure that out.”
You see, a lot of firms out there are like ships sailing without a map. They set all kinds of targets and measure lots of KPI’s – like rates, prices, and team utilization goals – but they’re basically shooting in the dark. They’re not able to connect those targets to a broader model for the business, and understand how they impact their financial performance and ultimately create profitability. Setting targets outside the context of a sound model is like trying to hit a bullseye blindfolded.
When our team engaged with each of these clients to develop a model for their business, both were able to see exactly why they were struggling, and how to get to profitability. In fact, we were able to show one client how to go from $1M in losses, to over $1.2M in profit without changing their prices, staffing model, or cutting any overhead expenses.
Crazy right?
That’s the power of a good model.
It’s like the GPS for your agency’s success. It not only clears up those murky targets but also lets you peek into the future. It helps you figure out if you’re on track and spots any gaps between your expectations and the real world.
So, it’s not just about managing a business; it’s about steering it confidently toward success.
Because at the end of the day, how can you achieve profitability if you’re not clear on what it looks like to be profitable?
Types of Profit Models
Profitability models focus primarily on assessing a company’s ability to generate profit. However, there isn’t a “standard way” to model an agency.
Different types of models will be designed to answer different questions. To make matters more complicated, most models will combine a few concepts together in order to answer a wide breadth of questions. Each of these models consider various income and expense categories to calculate profit margins and economic value added.
Before we break down how we develop models specifically designed for agencies and professional services firms, we’ll explain some of the different types of models you might come across in your research, or while speaking to accounting or consulting firms.
Cash-Flow Models
Examples: Cash Flow Model, Cost-Volume-Profit Analysis
Cash-flow models concentrate on the movement of cash into and out of a business. These models are vital for assessing a company’s liquidity, solvency, and overall financial flexibility. By examining operational, investing, and financing cash flows, businesses can ensure they maintain adequate cash levels to meet short-term obligations and invest in growth opportunities.
Investment Analysis Models
Examples: Return on Investment (ROI) Model, Return on Assets (ROA) Model, Return on Equity (ROE) Model, Discounted Cash Flow (DCF) Model
Investment analysis models are designed to evaluate the financial returns and risks associated with different investment opportunities. These models consider factors like net income, total assets, and future cash flows to calculate return ratios and investment values. They are crucial for investors and businesses alike to make informed investment decisions, allocate resources efficiently, and maximize returns on investments.
Integration of Different Types of Analysis in Profitability Models
There is a significant level of flexibility and adaptability in designing profitability models. Some models integrate various types of analysis, including profitability assessment, cash flow analysis, and investment evaluation. This integration is aimed at creating a comprehensive view of a business’s financial performance and investment attractiveness.
Since there is no one-size-fits-all approach, the design of a profitability model should be tailored to unveil specific insights aligned with the business’s goals, industry norms, and stakeholder expectations. A well-crafted model will not only quantify profitability but also offer actionable insights for strategic decision-making, investment allocation, and business optimization. The adaptability of these models lies in their ability to be customized and refined over time to align with evolving business landscapes and financial objectives.
At Parakeeto, we’ve spent the last five years refining our methodology for modeling Digital and Creative Agencies, and have also had the opportunity to apply it to other verticals in the professional services and consulting space. This model is primarily aimed at understanding the Gross and Operating profit potential of a firm, and identify the opportunities that might exist to improve the business’s performance by focusing on key operational levers.
Build Your Own Profit Model
Before you hop in – we should let you know that Parakeeto offers our own model generator tool in the Agency Profit Toolkit that will be able to aid you in this process. And, it’s totally free. Download yours here!
Check your inbox for your free toolkit!
What Makes Up a Profit Model?
From our perspective, well designed profit models for agencies and professional services should be broken down into four main areas: capacity, payroll, earning efficiency, and operating budgets.
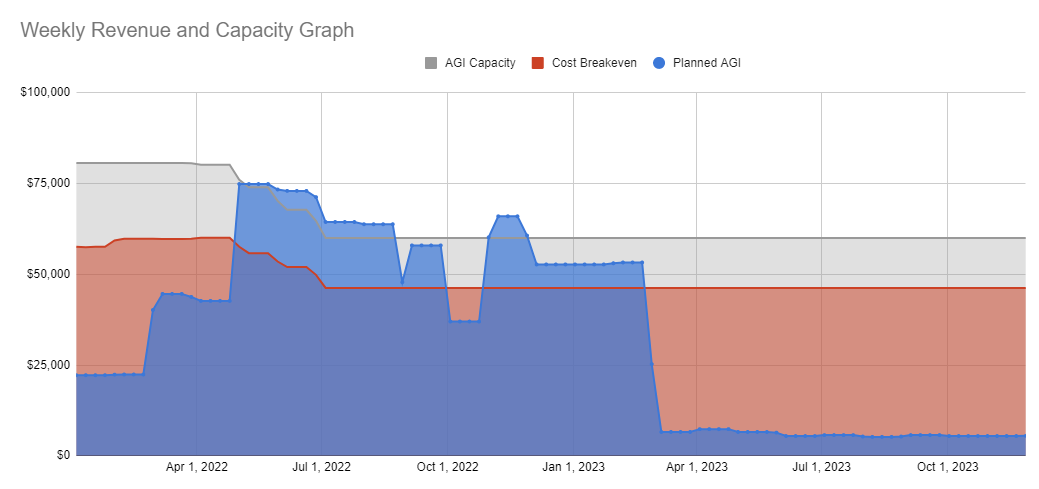
The above is a revenue and profit model that any clients of Parakeeto’s Predict service offering gain access to. Apply to work with us here, to learn more!
Capacity
Your capacity gives you an understanding of the total capacity your team has (all of their time), along with how much of that time can be spent doing client work based on your current assumptions. By gaining insight into your capacity, you’ll be able to see your team’s maximal utilization rate, and model how changes to your team affects these values. You can go deeper on Utilization and Capacity in this post.
This aspect is the foundation of a service-based profit model because at its core, a service business (by definition) relies on its capacity to earn revenue. Without a dynamic model for capacity, it will be impossible to accurately model how much revenue or profit a service-based business can earn in a given period of time.
Payroll
Payroll gives you an understanding of the total cost of your team, and how that cost is spread between those doing client work (Delivery, as we call it) and other key departments in your firm.
Payroll allocations will generally be split into 4 categories:
- Delivery
- Delivery Overhead
- Sales & Marketing
- Administration
These payroll models can help you understand how your cost model shifts as you make changes to your team. If you want to learn more about how to make this shift in your financial structure, check out this post.
Earning Efficiency
A profitability model must also measure earning efficiency, or how much revenue you expect to earn for every hour your team spends doing client work.
We represent this number as ABR (Average Billable Rate). This isn’t a rate card or a target rate for how much you’d like to earn for each hour of your team’s time. It’s how efficiently revenue is earned across any project or client, regardless of the billing model. It normalizes all people, projects, clients, and billing models over time and creates a baseline that can be measured over time.
This will allow you to calculate how much revenue can be generated by any given portion of your team over any given period of time, as well as how that revenue capacity changes as ABR goes up or down. More on rates here.
Note: working with Parakeeto will give you access to your own ABR reporting so that you know how efficiently you’re earning your revenue.

Operating Budgets
Finally, a profit model will need some form of operating budget to reference. This will allow you to model what amount of money you’ll be able to spend on the different areas of your business in order to achieve your profitability goals, and compare how your salary costs stack up relative to those budgets.
Generally, there are two ways to set those budgets:
- Absolute budgets: which are generally represented as an absolute dollar value
- Example: Sales & marketing budget = $150,000
- Relative budgets: which are generally represented as a percentage of Agency Gross Income (AGI)
- Example: Sales & marketing budget = 12% of AGI
The type of budget you choose to set will depend largely on what kind of scenarios you’re trying to model, and what questions you’re attempting to answer. Absolute budgets are typically used when trying to model iterations on a current plan and answering questions like “If everything stayed the same, but we improved our utilization rate by 2%, how would that impact our bottom line?
Whereas relative budgets are more suited to modeling a nascent set of projections where budgets have not already been established. This would help us answer a question like “If we achieve 50% utilization and a $150 ABR, what can we afford to spend on overhead and still land at a 30% EBITDA?”
If you’d like to get an idea of how to implement this at your own agency, reference this post.
Step 1: Model Capacity
To build your own profit model, let’s start with defining our team’s capacity. Exactly how this will be laid out is up to you, but you can follow this checklist to ensure all of the appropriate data is present:
- List out everyone on your team & planned hires w/ a date
- List out their total capacity (usually 40 hours per week)
- List out their delivery expectations (industry standard utilization rates can be found here) and their department that they’re allocated to.
- List out their PTO & Holidays
- Include everyone on the team, including non-delivery staff
- This is not to be confused with your actual time spent historically, and is meant to represent how time would be allocated in an ideal/realistic scenario.
This gives us a sense of our total delivery capacity & maximal utilization rate
Example:
Here is how we’d lay this out, if we were you!
Start Date | Name/Role | Total Comp | Working Hrs per week/year | Deliv Hrs Expected per week/year | Yearly PTOdays/hrs |
1/1/2023 | Rob/Developer | $85k/yr | 40/2080 | 32/1664 | 25/200 |
1/1/2022 | Tino/Exec Assistant | $35k/yr | 40/2080 | 0/0 | 25/200 |
6/1/2023 | Marsha/Designer | $75k/yr | 40/2080 | 32/1664 | 25/200 |
1/1/2022 | Sam/CEO | $110k/yr | 40/2080 | 7/364 | 30/240 |
1/1/2023 | Sally/Developer | $85k/yr | 40/2080 | 32/1664 | 25/200 |
1/1/2023 | Alyson/Developer | $85k/yr | 40/2080 | 32/1664 | 25/200 |
1/1/2023 | Amit/Developer | $85k/yr | 40/2080 | 32/1664 | 25/200 |
1/1/2023 | Sharon/Developer | $85k/yr | 40/2080 | 32/1664 | 25/200 |
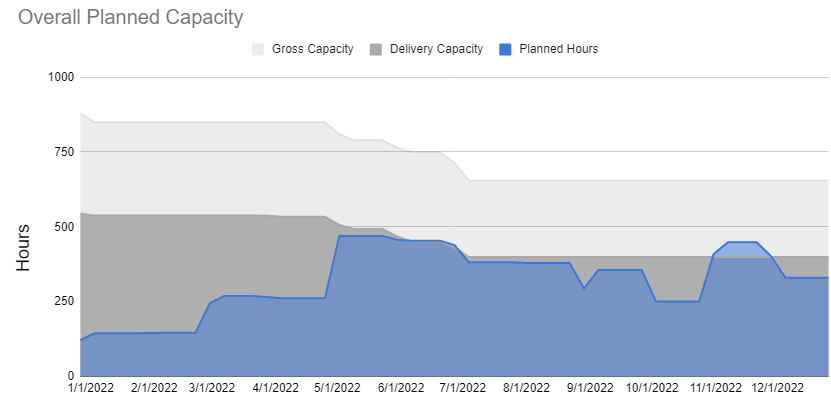
Did you know – working with Parakeeto can give you access to capacity reporting for your agency like this? Apply to work with us here!
Step 2: Allocate Salaries
Next step is to allocate our team’s salaries to specific departments. The checklist for what to include is below:
- List out the Total Compensation of each employee
- In this summated number, include:
- Benefits
- Bonuses
- Commissions
- In this summated number, don’t include:
- Profit sharing
- Non-guaranteed bonuses
- Allocate these salaries with the core split being Delivery vs Non-Delivery (overhead) we recommend breaking overhead down further into Sales & Marketing and Admin.
- Note: this is not to be confused with your actual time spent historically, and is meant to represent how a person’s role would be allocated in an ideal/realistic scenario. By allocating salaries based on time spent, you’ll end up hiding things like the cost of poor historical utilization in overhead and creating a distorted view of your agency’s ability to generate revenue and profit.
Example:
New columns to reflect the salary allocations have been reflected in green below:
Start Date | Name/Role | Total Comp | Delivery Depart % | Admin Depart % | S&M Depart % | Working Hrs per week/year | Deliv Hrs Expected per week/year | Yearly PTOdays/hrs |
1/1/2023 | Rob/Developer | $85k/yr | 100% | 0% | 0% | 40/2080 | 32/1664 | 25/200 |
1/1/2022 | Tino/Exec Assistant | $35k/yr | 0% | 100% | 0% | 40/2080 | 0/0 | 25/200 |
6/1/2023 | Marsha/Designer | $75k/yr | 100% | 0% | 0% | 40/2080 | 32/1664 | 25/200 |
1/1/2022 | Sam/CEO | $110k/yr | 25% | 25% | 50% | 40/2080 | 7/364 | 30/240 |
1/1/2023 | Sally/Developer | $85k/yr | 100% | 0% | 0% | 40/2080 | 32/1664 | 25/200 |
1/1/2023 | Alyson/Developer | $85k/yr | 100% | 0% | 0% | 40/2080 | 32/1664 | 25/200 |
1/1/2023 | Amit/Developer | $85k/yr | 100% | 0% | 0% | 40/2080 | 32/1664 | 25/200 |
1/1/2023 | Sharon/Developer | $85k/yr | 100% | 0% | 0% | 40/2080 | 32/1664 | 25/200 |
Step 3: Model Revenue Earning Efficiency & Revenue Capacity
Next, we’ll need to model out your earning efficiency and revenue capacity. Here is your checklist:
- List out the earning efficiency you expect for the team, this can be done as a blended rate across the org (recommended initially) or by individual.
- This should be your “Model” Average Billable Rate (go deeper on ABR here) across all the different pricing models you might be using.
- Note: This is not to be confused with your “rate card” or “target rate” this is meant to be the efficiency at which you think you can actually earn revenue in an ideal/realistic scenario.
This will allow you to multiply each person’s delivery capacity by that ABR and understand their revenue capacity, and your team’s revenue capacity as a whole.
Example:
Start Date | Name/Role | Total Comp | Deliv Hrs Expected per week/year | Model ABR | Revenue Capacity |
1/1/2023 | Rob/Developer | $85k/yr | 32/1664 | $175 | $291,200 |
1/1/2022 | Tino/Exec Assistant | $35k/yr | 0/0 | $175 | $0 |
6/1/2023 | Marsha/Designer | $75k/yr | 32/1664 | $175 | $291,200 |
1/1/2022 | Sam/CEO | $110k/yr | 7/364 | $175 | $63,700 |
1/1/2023 | Sally/Developer | $85k/yr | 32/1664 | $175 | $291,200 |
1/1/2023 | Alyson/Developer | $85k/yr | 32/1664 | $175 | $291,200 |
1/1/2023 | Amit/Developer | $85k/yr | 32/1664 | $175 | $291,200 |
1/1/2023 | Sharon/Developer | $85k/yr | 32/1664 | $175 | $291,200 |
Total: $1.81M |
Step 4: Set Budgets
For the fourth step, you’ll want to set budgets for the 4 major categories as a percentage of your AGI.
AGI is a metric called Agency Gross Income that we use to benchmark these budgets off of instead of Revenue. AGI is revenues with any Pass-Through Expenses stripped out. It’s a better reflection of “true” income since the number isn’t inflated by pass-through costs like print budgets, ad spends, and other white labeled services. More on AGI here.
- The 4 major categories you’ll want to budget out are:
- Delivery: how much you can spend on delivery payroll and shared delivery expenses while still maintaining your target Delivery Margin.
- Generally we recommend keeping this to under 50% of AGI.
- Overhead (20-30% of AGI) which can be broken down further into:
- Sales & Marketing: how much you can spend on sales and marketing-related payroll and other expenses like software, freelancers, ads, etc.
- Generally we recommend 8-14% of AGI.
- Administration: how much you can spend on payroll and other related expenses (legal fees, accounting, software, HR, etc)
- Facilities: how much you can spend on payroll and other related expenses (rent, utilities, maintenance, equipment, etc)
- Generally we recommend 4-6% for office-based on hybrid companies
- 0-3% for remote
Example:
With this in mind, here is how you could lay this out:
Metric | Source | Recommendation/Benchmark | Modeled Number |
AGI | Summated output of your team’s yearly revenue capacity. | n/a | $1.81M |
Delivery | All delivery team related expenses. | 50% of AGI capacity. | $900,000 |
Overheads: | |||
S&M | All sales and marketing related expenses. | 8-14% of AGI capacity. | $180,000 |
Admin | All administrative department related expenses. | 8-14% of AGI capacity. | $175,000 |
Facilities | All facilities related expenses. | 4-6% of AGI capacity. | $90,000 |
Operating Income | Revenues minus pass-through, delivery and overhead expenses. | 25%+ of AGI capacity. | $450,000 |
Step 5: Model Scenarios
The last and most exciting step is to model how tweaks to your agency can improve your performance, there are several levers you can play with:
- Capacity & Payroll
- Model out potential changes to your team composition, or the expectations you set for your team as it relates to delivery time, time off, compensation, etc. Then, see how it impacts your overall profitability. To see an example of this kind of modeling in action, Check out this post where we break down how a firm shifting to a 4-day work week can do so without decreasing profitability.
- Budgets & Allocations
- You can see how tweaks to your budgets and payroll allocations impact your performance and profitability.
- Utilization & ABR
- You can model how pulling your two most powerful levers for increasing revenue impacts your revenue capacity.
Note: Parakeeto offers an agency model generator in the Agency Profit Toolkit. It will walk you through Steps 1-5 of this post. Download it for free here!
Example:
Imagine a scenario where you’re considering hiring two more team members to keep up with an increase in demand. Are you profitable enough to handle this change? You can model it out using the steps above and contrast models. Let’s take our example from earlier steps and use it as the baseline:
Metric | Source | Recommendation/Benchmark | Modeled Number |
AGI | Summated output of your team’s yearly revenue capacity. | n/a | $1.81M |
Delivery | All delivery team related expenses. | 50% of AGI capacity. | $900,000 |
Overheads: | |||
S&M | All sales and marketing related expenses. | 8-14% of AGI capacity. | $180,000 |
Admin | All administrative department related expenses. | 8-14% of AGI capacity. | $175,000 |
Facilities | All facilities related expenses. | 4-6% of AGI capacity. | $90,000 |
Operating Income | Revenues minus pass-through, delivery and overhead expenses. | 25%+ of AGI capacity. | $450,000 |
Now, in a world where we added two team members to our team, here is what kind of impact that might have:
Start Date | Name/Role | Total Comp | Deliv Hrs Expected per week/year | Model ABR | Revenue Capacity |
1/1/2023 | Rob/Developer | $85k/yr | 32/1664 | $175 | $291,200 |
1/1/2022 | Tino/Exec Assistant | $35k/yr | 0/0 | $175 | $0 |
6/1/2023 | Marsha/Designer | $75k/yr | 32/1664 | $175 | $291,200 |
1/1/2022 | Sam/CEO | $110k/yr | 7/364 | $175 | $63,700 |
1/1/2023 | Sally/Developer | $85k/yr | 32/1664 | $175 | $291,200 |
1/1/2023 | Alyson/Developer | $85k/yr | 32/1664 | $175 | $291,200 |
1/1/2023 | Amit/Developer | $85k/yr | 32/1664 | $175 | $291,200 |
1/1/2024 | TBD1/Designer | $75k/yr | 32/1664 | $175 | $291,200 |
1/1/2024 | TBD2/Designer | $75k/yr | 32/1664 | $175 | $291,200 |
$2.4M |
And its impact on the core financials:
Metric | Modeled Number | Model w/ New Team |
AGI | $1.81M | $2,393,300 |
Delivery Expenses | $900,000 | $1.19M |
Overheads: | ||
S&M | $180,000 | $230,000 |
Admin | $175,000 | $220,000 |
Facilities | $90,000 | $100,000 |
Operating Income | $450,000 | $600,000 |
Step 6: Compare Actual Performance
This is an optional, but strongly recommended step. Once you have your model framed out, you can restructure your P&L and time tracing data to align to this model, and measure how you compared to these targets.
Compare and contrast:
- Did you achieve your desired delivery margin and spend the right amount on delivery?
- How did your overhead spending compare to your budgets?
- What was your ABR compared to your model?
- How close to your model Utilization was your actual Utilization rate?
This can help you identify where there may be gaps and opportunities in your agency to improve profitability.
Looking for Expert Help Modeling Your Agency?
Parakeeto’s Audit service offering might be exactly what you’re looking for.
We model your agency to get an accurate picture of what your agency is capable of doing, and compare it to your last 24 months of performance to outline where your areas for improvement are.
You in?
Conclusion
The first step to running a highly profitable agency is being able to see what success looks like. Models are a powerful way to gain extreme clarity on exactly what your agency is capable of, and how you can make tweaks to improve its performance. By breaking it down into four key areas—capacity, payroll, earning efficiency, and operating budgets—you gain a clear roadmap to profitability.
It all starts with modeling your team’s capacity, allocating salaries, and calculating revenue-earning efficiency. Setting budgets based on Agency Gross Income (AGI) guides your spending in a way that aligns with your profitability goals. And perhaps most exciting of all, you can use this model to simulate various scenarios, from team expansions to budget adjustments, to see how they impact your agency’s performance.
By comparing your actual performance to the model, you can continually refine your strategies and unlock new opportunities for profitability. Remember, it’s not just about crunching numbers; it’s about steering your agency confidently toward financial success.
Written by
Marcel Petitpas
Marcel is an agency profitability optimization consultant, keynote speaker and the CEO of Parakeeto. He's on a mission to help the average agency get the information they need to be more profitable. From sharing educational content and resources to creating tools at Parakeeto to make measuring the most important metrics easier - everything he does is aimed at making agency profitability more accessible.
Free Resource
Get the Agency Profitability Toolkit
Free tools, templates, and training videos to measure the right metrics and improve your profitability.
Free Consultation
Ready to Improve Your Agency's Profitability?
Schedule a free consultation with a profitability expert to find out how much money you're leaving on the table.
Free Consultation
Related Posts

The Process Behind Profit Management, with Kristen Kelly — Ep. 170
About this Episode In this episode of the Agency Profit Podcast, Marcel welcomes back operations expert Kristen Kelly for a deep dive into the often-overlooked key to agency profitability—process. While most agencies focus on data and frameworks, Kristen explains why a strong, adaptable process is essential for maintaining clean data, managing inevitable changes, and ensuring […]

Maximizing Project Profit Margin: A Guide to Increasing Returns
In this guide you'll learn the key strategies required for calculating and maximizing your agency's project profit margin.

How to be Profitable at Any Size, with Drew McLellan — Ep. 217
About this Episode In this episode of the Agency Profit Podcast, Marcel Petitpas is joined by Drew McLellan, founder of Agency Management Institute, to unpack what profitability really looks like at different stages of agency growth. Drawing on decades of experience and financial data from more than 250 agencies, Drew explains why every agency can […]

Increasing Agency Profits with Customer Lifetime Value, with Robert Patin – Episode 128
About This Episode The Agency Profit podcast, hosted by Marcel Petitpas, delves into the intricacies of agency operations, making it a must-listen for agency owners and industry enthusiasts. In this episode, Marcel is joined by Robert Patin, a respected consultant, author, and founder of Creative Agency Success. They discuss the critical concept of Client Lifetime […]

How to Increase Your Profit While Working Less Hours, with Mike Moll – Episode 88
In this episode of APP, Mike Moll of Market Me joins Marcel to outline how you can increase your profit while working fewer hours.

How your People Empower your Profits, with Lindsey Groepper – Episode 99
This week, BLASTmedia's Lindsey Groepper charts how your people empower your profits and how best to avoid employee churn

How Can Niching and Specialization Lead Your Agency to Higher Profit, with Rob Da Costa – Episode 74.
In Episode 74, founder of Da Costa Coaching – Rob Da Costa – outlines how niching and specialization can lead your agency to higher profit

3 Key Profitability Drivers Agencies Need to Prioritize
Discover the top 3 profitability drivers every agency should focus on to maximize success and ultimately drive more profit.

Taking Actions on Profitability Improvements, with Mandi Ellefson –Ep.183
About this Episode In this episode of the Agency Profit Podcast, Marcel chats with Mandi Ellefson from Hands-Off CEO about why so many agency owners know what to do to grow—but still don’t do it. Spoiler: it’s not about strategy; it’s about avoiding discomfort. They break down the three keys to profitability—charging more, using your […]